
Is Austin tap water safe to drink?
In the latest results, every contaminant we list with a single federal limit was below that limit or action level. Lead was reported to EPA as 0 ppb at the 90th percentile, below the 15 ppb action level. EPA’s goal for lead is zero. PFOA or PFOS was found at or above 4.0 ppt, the new federal limit. Utilities must comply from 2029, based on a running annual average, so a single test result is not a violation. EPA lists 5 health-based violations in the last 10 years, the latest in Feb 2022. See how US tap water compares nationally.
What’s in Austin tap water
Latest results from Austin Water’s 2025 report and EPA records. One row per contaminant, with the type of limit in the limit column.
| Contaminant | Result | Limit | Sampled | Source |
|---|---|---|---|---|
| LeadComes mostly from home plumbing, not from the source water. | 0 ppb 90th percentile reported to EPA as 0; previous round (2019–2021): 0 ppb | 15 ppbAction level · goal 0Drops to 10 ppb on Nov 1, 2027 (Lead and Copper Rule Improvements). | 2022–2024 | EPA SDWIS record, TX2270001 |
| PFOAA “forever chemical” with a federal limit. | Not detected Found in 0 of 12 samples at 3 entry points | 4.0 pptLegal limit (MCL) · goal 0Applies to a running annual average. Utilities must comply from 2029; EPA proposed 2031 in May 2026. | Oct 2023 – Jul 2024 | EPA UCMR 5 final occurrence data (Aug 2026 release) |
| PFOSA “forever chemical” with a federal limit. | Up to 4.8 ppt Found in 2 of 12 samples at 3 entry points | 4.0 pptLegal limit (MCL) · goal 0Applies to a running annual average. Utilities must comply from 2029; EPA proposed 2031 in May 2026. | Oct 2023 – Jul 2024 | EPA UCMR 5 final occurrence data (Aug 2026 release) |
| Other PFASFound among the 27 other PFAS EPA had utilities test. | 5 found PFBA up to 8.4 ppt; PFHxS up to 6.2 ppt; PFBS up to 5.1 ppt; PFPeA up to 4.1 ppt; PFHxA up to 3.3 ppt | VariesSet per compound in EPA’s PFAS rule | Oct 2023 – Jul 2024 | EPA UCMR 5 final occurrence data (Aug 2026 release) |
| Total trihalomethanesByproducts of disinfection. | 45.5 ppb Highest locational running annual average; range 31.4–53.9 | 80 ppbLegal limit (MCL) | 2025 | Austin Water Annual Water Quality Report 2025 |
| Haloacetic acids (HAA5)Byproducts of disinfection. | 15.6 ppb Highest locational running annual average; range 8.4–21.1 | 60 ppbLegal limit (MCL) | 2025 | Austin Water Annual Water Quality Report 2025 |
| Chloramine (as total chlorine)Disinfectant kept in the pipes on purpose. | 2.3 mg/L Average; range 0.06–3.1 | 4.0 mg/LDisinfectant limit (MRDL) · goal 4 | 2025 | Austin Water Annual Water Quality Report 2025 |
ppb = parts per billion (µg/L), ppt = parts per trillion (ng/L). The bar shows the result against the limit (black line). Limits: EPA drinking water regulations, PFAS rule, Lead and Copper Rule Improvements. “Not detected” means below the lab’s reporting level, not zero.
EPA violations
EPA’s SDWIS database lists 6 violation records for Austin Water since 2008, 5 of them health-based. All have a return-to-compliance date.
Not listed: 1 older monitoring, reporting or notice record (2008), none health-based.
Shown: health-based violations and everything from the last 10 years. Source: EPA SDWIS record, TX2270001, retrieved Oct 13, 2026.
How hard is Austin water?
The utility’s figures cover the whole system. To test the hardness at your tap, strips or a drop kit take minutes.
Classes: USGS (0–60 mg/L soft, 61–120 moderately hard, 121–180 hard, above 180 very hard). 1 gpg = 17.1 mg/L as calcium carbonate. Source: Austin Water Annual Water Quality Report 2025.
What to do with these numbers
Only what the data above points to.
PFOA or PFOS found in testing
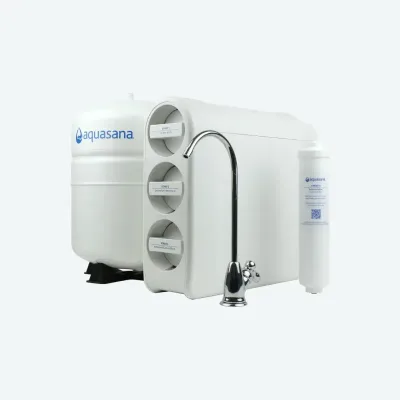
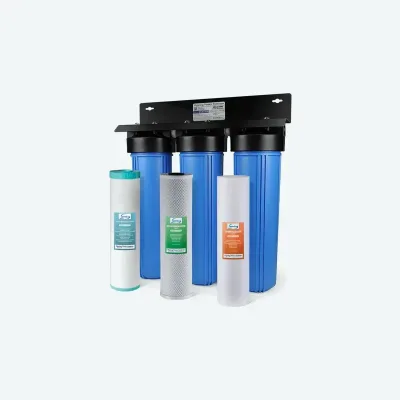
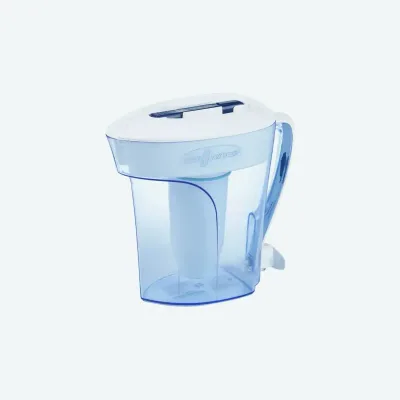
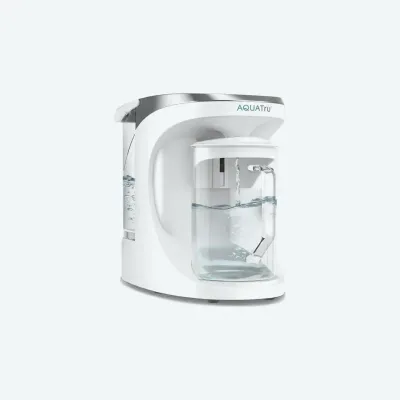
Filters certified to NSF/ANSI 53 or 58 for PFOA and PFOS reduce them at the tap.
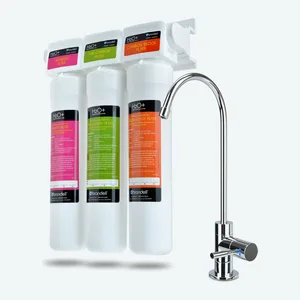
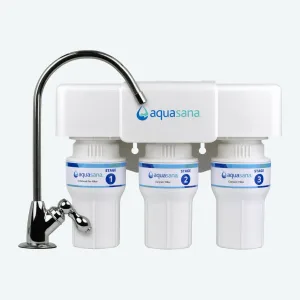
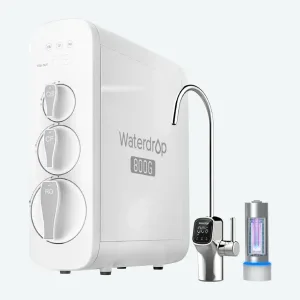
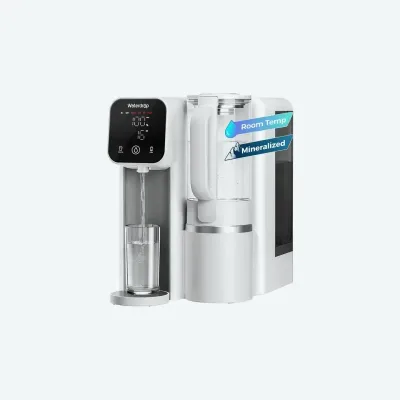
Certified to reduce PFOA and PFOS. PFAS is not necessarily in your water.
Reverse osmosis systems →Chloramine taste and smell
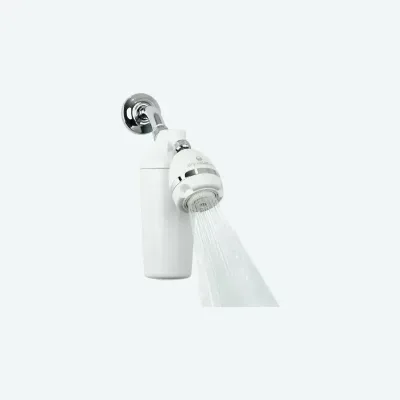
Austin Water disinfects with chloramine on purpose, below the 4.0 mg/L limit. If you dislike the taste, look for a filter certified to NSF/ANSI 42 for chloramine. For home dialysis and aquariums it must be reduced first.
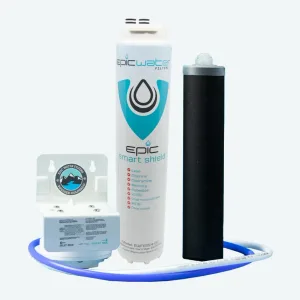
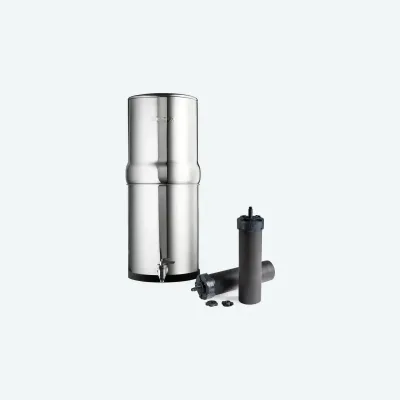
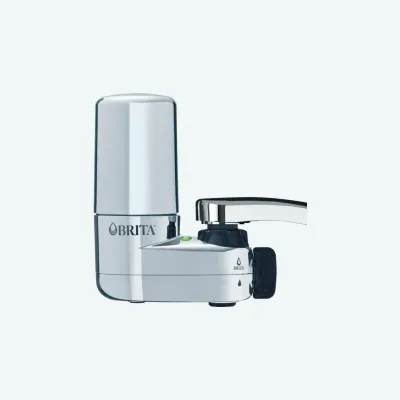
Certified to reduce chloramine.
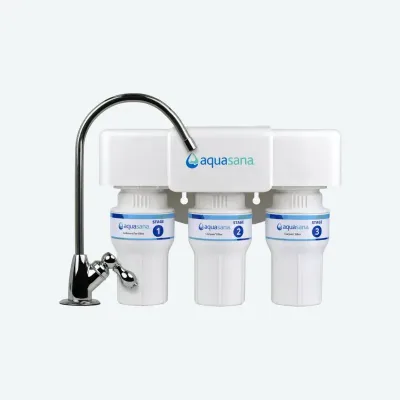
Under-sink filters compared →Test your own water
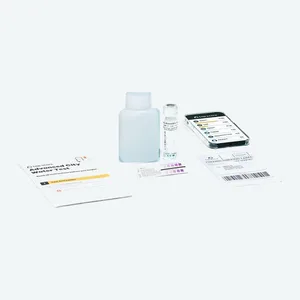
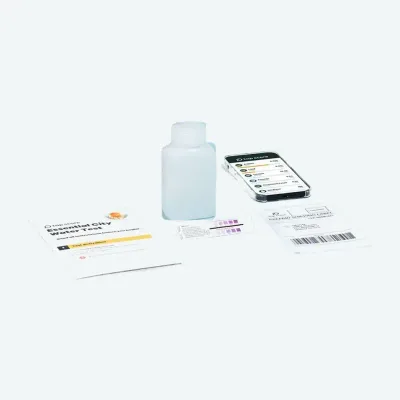
Austin Water’s numbers come from its own sampling sites. A certified lab test of your faucet shows lead and copper from your plumbing and the chloramine level at your tap. How to test your own tap for lead, starting with your water utility.
All water tests compared →