
Is tap water safe to drink in the US?
The question “is tap water safe to drink” has a legal answer and a practical one. The legal one: CDC says 9 in 10 people in the US get their tap water from a public water system, and that system must meet EPA standards. EPA has drinking water regulations for more than 90 contaminants, from bacteria and nitrate to lead, arsenic and disinfection byproducts. EPA's WaterSense program calls the public supply “some of the safest in the world.”
The practical answer has more layers. What the utility sends is sampled on a schedule and published in a yearly report. What your own pipes add is mostly lead, which enters between the street main and your faucet, so two houses on one system can get different water. And about 43 million people on private wells sit outside these rules altogether.
When something goes wrong at the plant, the rules put the burden on the utility. Per EPA’s public notification rule, a problem that could affect health right away must be announced within 24 hours. A violation without immediate risk gets a notice within 30 days, and minor ones can wait for the annual report.
What the data shows for 125 large US cities
We built a page for each of 125 large cities from EPA's federal records and the utility's own report. Together their main systems serve about 80.4 million people. Here is the short version of each, largest system first.
| City | Lead, 90th percentile | PFOA or PFOS, highest sample | Health-based violations, 10 years |
|---|---|---|---|
| New York, NY | 10 ppb | Not detected | 1, latest Feb 2017 |
| Los Angeles, CA | 3.9 ppb | Not detected | 1, latest Jan 2018 |
| Houston, TX | 5 ppb | No PFOA/PFOS; 4 other PFAS | 1, latest May 2025 |
| Chicago, IL | 6.4 ppb | Not detected | None listed |
| San Antonio, TX | 1.6 ppb | No PFOA/PFOS; 3 other PFAS | None listed |
| Miami, FL | 3.1 ppb | PFOS up to 33 ppt | None listed |
| Phoenix, AZ | 2.7 ppb | No PFOA/PFOS; 2 other PFAS | 1, latest Jan 2021 |
| Philadelphia, PA | 2 ppb | PFOA up to 8.1 ppt | None listed |
| Baltimore, MD | 2.7 ppb | No PFOA/PFOS; 1 other PFAS | 3, latest Apr 2026 |
| Las Vegas, NV | 2.1 ppb | No PFOA/PFOS; 2 other PFAS | None listed |
| Oakland, CA | 0 ppb | No PFOA/PFOS; 2 other PFAS | None listed |
| Berkeley, CA | 0 ppb | No PFOA/PFOS; 2 other PFAS | None listed |
| San Diego, CA | 0 ppb | Not detected | None listed |
| Dallas, TX | 1.1 ppb | PFOA up to 6.3 ppt | None listed |
| Columbus, OH | 1.2 ppb | PFOA up to 5.3 ppt | None listed |
| Cleveland, OH | 0 ppb | Not detected | None listed |
| Denver, CO | 3.6 ppb | Not detected | None listed |
| Charlotte, NC | 0 ppb | No PFOA/PFOS; 2 other PFAS | None listed |
| Seattle, WA | 1.6 ppb | Not detected | None listed |
| Austin, TX | 0 ppb | PFOS up to 4.8 ppt | 5, latest Feb 2022 |
| Atlanta, GA | 1.4 ppb | No PFOA/PFOS; 4 other PFAS | 5, latest Apr 2019 |
| San Jose, CA | 0 ppb | PFOS up to 6.2 ppt | 1, latest Jun 2023 |
| Fort Worth, TX | 3 ppb | PFOA up to 8.3 ppt | 1, latest Mar 2021 |
| Indianapolis, IN | 3.4 ppb | No PFOA/PFOS; 4 other PFAS | None listed |
| San Francisco, CA | 4.9 ppb | Not detected | None listed |
| Jacksonville, FL | 1.5 ppb | No PFOA/PFOS; 2 other PFAS | None listed |
| Louisville, KY | 1.1 ppb | PFOA up to 7.5 ppt | None listed |
| Cincinnati, OH | 2.1 ppb | PFOS up to 6.1 ppt | None listed |
| Nashville, TN | 0.8 ppb | Not detected | None listed |
| El Paso, TX | 0 ppb | PFOS up to 8.5 ppt | None listed |
| Tampa, FL | 1.5 ppb | PFOS up to 6.9 ppt | None listed |
| Tucson, AZ | 0.6 ppb | No PFOA/PFOS; 1 other PFAS | None listed |
| Boston, MA | 5.8 ppb | Not detected | 1, latest Nov 2020 |
| Portland, OR | 5 ppb | Not detected | 1, latest Dec 2017 |
| Omaha, NE | 12.3 ppb | Not detected | None listed |
| Memphis, TN | 4.7 ppb | Not detected | None listed |
| Raleigh, NC | 0 ppb | PFOS up to 5.6 ppt | None listed |
| Oklahoma City, OK | 0 ppb | No PFOA/PFOS; 1 other PFAS | None listed |
| Detroit, MI | 7.5 ppb | Not detected | None listed |
| Washington, DC | 2 ppb | No PFOA/PFOS; 2 other PFAS | None listed |
| Honolulu, HI | 0 ppb | No PFOA/PFOS; 1 other PFAS | None listed |
| Milwaukee, WI | 5.3 ppb | Not detected | None listed |
| Baton Rouge, LA | 1 ppb | Not detected | None listed |
| Albuquerque, NM | 0 ppb | Not detected | None listed |
| Kansas City, MO | 2.1 ppb | No PFOA/PFOS; 1 other PFAS | 1, latest Mar 2019 |
| Fresno, CA | 0 ppb | PFOS up to 30 ppt | None listed |
| Orlando, FL | 2 ppb | Not detected | 1, latest Jul 2019 |
| Aurora, CO | 4.7 ppb | No PFOA/PFOS; 4 other PFAS | None listed |
| Sacramento, CA | 0 ppb | PFOS up to 41.4 ppt | None listed |
| Pittsburgh, PA | 2 ppb | Not detected | 2, latest Jul 2018 |
| Long Beach, CA | 1 ppb | Not detected | None listed |
| Colorado Springs, CO | 5.7 ppb | Not detected | None listed |
| Irvine, CA | 0 ppb | No PFOA/PFOS; 2 other PFAS | None listed |
| Tacoma, WA | 0 ppb | No PFOA/PFOS; 2 other PFAS | None listed |
| Reno, NV | 0 ppb | PFOS up to 20 ppt | None listed |
| Virginia Beach, VA | 0 ppb | Not detected | None listed |
| Minneapolis, MN | 2 ppb | No PFOA/PFOS; 1 other PFAS | None listed |
| New Haven, CT | 0 ppb | PFOS up to 10.7 ppt | None listed |
| Arlington, TX | 1.2 ppb | PFOS up to 4.6 ppt | None listed |
| Tulsa, OK | 1.5 ppb | Not detected | None listed |
| Wichita, KS | 1.4 ppb | Not detected | None listed |
| St. Paul, MN | 10 ppb | No PFOA/PFOS; 2 other PFAS | 1, latest Apr 2022 |
| Salt Lake City, UT | 2.5 ppb | PFOS up to 7.1 ppt | 1, latest Sep 2017 |
| Toledo, OH | 0 ppb | No PFOA/PFOS; 1 other PFAS | 1, latest Mar 2023 |
| Anaheim, CA | 0 ppb | PFOS up to 29 ppt | None listed |
| Spokane, WA | 2 ppb | PFOS up to 6.1 ppt | None listed |
| New Orleans, LA | 6 ppb | PFOS up to 4.2 ppt | 1, latest Jan 2025 |
| Durham, NC | 0 ppb | PFOS up to 5.8 ppt | None listed |
| Providence, RI | 1.7 ppb | Not detected | 1, latest Jul 2018 |
| Corpus Christi, TX | 1.4 ppb | No PFOA/PFOS; 3 other PFAS | 2, latest Feb 2021 |
| Grand Rapids, MI | 7 ppb | Not detected | None listed |
| St. Louis, MO | 1.8 ppb | Not detected | None listed |
| Lincoln, NE | 4.5 ppb | Not detected | None listed |
| Newark, NJ | 4 ppb | PFOA up to 5.3 ppt | 16, latest Jul 2022 |
| Charleston, SC | 3.5 ppb | PFOS up to 6.5 ppt | 2, latest Jul 2025 |
| Buffalo, NY | 3 ppb | Not detected | None listed |
| Madison, WI | 1.8 ppb | No PFOA/PFOS; 2 other PFAS | 1, latest Oct 2024 |
| Fort Wayne, IN | 2.6 ppb | No PFOA/PFOS; 2 other PFAS | 1, latest Jan 2022 |
| Lubbock, TX | 1.4 ppb | No PFOA/PFOS; 1 other PFAS | None listed |
| Boise, ID | 2 ppb | Not detected | None listed |
| Jersey City, NJ | 7.8 ppb | PFOA up to 9.2 ppt | 1, latest Aug 2020 |
| Laredo, TX | 1.4 ppb | No PFOA/PFOS; 1 other PFAS | 4, latest May 2026 |
| Knoxville, TN | 0.6 ppb | No PFOA/PFOS; 1 other PFAS | None listed |
| Des Moines, IA | 0 ppb | Not detected | 1, latest May 2017 |
| Pensacola, FL | 0.6 ppb | PFOS up to 35.7 ppt | None listed |
| Scottsdale, AZ | 2.3 ppb | No PFOA/PFOS; 1 other PFAS | None listed |
| Richmond, VA | 3.6 ppb | Not detected | 1, latest Jul 2020 |
| Anchorage, AK | 0 ppb | PFOA up to 9.1 ppt | None listed |
| Sioux Falls, SD | 3 ppb | Not detected | None listed |
| Wilmington, NC | 0 ppb | No PFOA/PFOS; 1 other PFAS | None listed |
| Tallahassee, FL | 1.4 ppb | PFOS up to 7.9 ppt | None listed |
| Kalamazoo, MI | 4 ppb | PFOS up to 6.7 ppt | 4, latest Jul 2019 |
| Syracuse, NY | 12 ppb | Not detected | 16, latest Mar 2025 |
| Fort Lauderdale, FL | 4.9 ppb | PFOS up to 16 ppt | None listed |
| Savannah, GA | 3.9 ppb | Not detected | None listed |
| Boulder, CO | 2 ppb | Not detected | 2, latest Jul 2017 |
| Sunnyvale, CA | 0 ppb | Not detected | None listed |
| Asheville, NC | 0 ppb | Not detected | 2, latest Oct 2024 |
| Pasadena, TX | 3.7 ppb | PFOS up to 4.9 ppt | None listed |
| Bellingham, WA | 3.4 ppb | Not detected | None listed |
| Santa Clara, CA | 2.7 ppb | Not detected | None listed |
| Boca Raton, FL | 0.6 ppb | PFOS up to 7.1 ppt | 1, latest Aug 2019 |
| Ann Arbor, MI | 2.3 ppb | No PFOA/PFOS; 3 other PFAS | None listed |
| Ventura, CA | 0 ppb | No PFOA/PFOS; 2 other PFAS | 1, latest Jul 2018 |
| Santa Cruz, CA | 0 ppb | Not detected | None listed |
| Santa Barbara, CA | 2.5 ppb | Not detected | None listed |
| Santa Fe, NM | 1.1 ppb | Not detected | 1, latest Oct 2024 |
| Santa Monica, CA | 1.4 ppb | PFOA up to 4.6 ppt | None listed |
| Brooklyn Park, MN | 1 ppb | PFOA up to 10.5 ppt | None listed |
| Key West, FL | 4 ppb | PFOS up to 50.3 ppt | None listed |
| Woodbury, MN | 3 ppb | PFOA up to 17.1 ppt | None listed |
| Maple Grove, MN | 2 ppb | No PFOA/PFOS; 1 other PFAS | None listed |
| Mountain View, CA | 0 ppb | Not detected | None listed |
| Flint, MI | 3 ppb | Not detected | 1, latest Oct 2024 |
| Flagstaff, AZ | 3.6 ppb | No PFOA/PFOS; 1 other PFAS | None listed |
| Plymouth, MN | 2 ppb | No PFOA/PFOS; 1 other PFAS | None listed |
| Palm Springs, CA | 0 ppb | Not detected | None listed |
| Iowa City, IA | 4 ppb | Not detected | None listed |
| Eagan, MN | 0 ppb | No PFOA/PFOS; 1 other PFAS | None listed |
| Palo Alto, CA | 0 ppb | Not detected | None listed |
| Pflugerville, TX | 1.1 ppb | PFOS up to 14.4 ppt | 14, latest Jul 2025 |
| Burlington, NC | 0 ppb | PFOS up to 17 ppt | 1, latest Jul 2021 |
| Ames, IA | 0 ppb | Not detected | None listed |
| Myrtle Beach, SC | 0.7 ppb | PFOA up to 5.3 ppt | None listed |
| South Lake Tahoe, CA | 0 ppb | PFOA up to 6.1 ppt | None listed |
Three things stand out. None of the 125 systems is above the 15 ppb lead action level. The highest is Omaha at 12.3 ppb. In 40 of 125, at least one sample of PFOA or PFOS reached 4 ppt, the level of the coming federal limit. And 38 had at least one health-based violation in the last 10 years, 25 of them only for “treatment technique,” meaning a required treatment step was missed or late rather than a measured level going over a limit.
Nationally, EPA's UCMR 5 program sampled 10,313 public systems for 29 PFAS between 2023 and 2025. Of those, 3,595 (35%) found at least one PFAS, and 1,739 (17%) had a PFOA or PFOS sample at 4 ppt or more.
Look up the water system for your ZIP
Shows the public systems EPA links to your ZIP, their PFAS result, and our city page when we have one.
We don't label a city safe or unsafe. Each page puts the reading next to its legal limit and the date, and says which source it came from.
Lead comes from pipes, not from the treatment plant
Lead is the main reason a city can meet every limit and one kitchen tap still has a problem. EPA says lead service lines are usually the biggest source, and that homes built before 1986 are more likely to have lead pipes, solder or fixtures. Without a lead line, brass faucets and old solder can still add some. EPA and CDC both say there is no known safe level of lead in a child's blood.
The Lead and Copper Rule Improvements, finalized in October 2024, require water systems to find and replace lead pipes within 10 years, test more often and act at a lower lead level. Until your street is done, EPA's own advice is practical:
- Use only cold water for drinking, cooking and baby formula. Boiling does not reduce lead.
- Run the tap, take a shower or run a load of laundry before drinking. The longer water sits in the pipes, the more lead it may hold.
- Clean the faucet aerator, where lead particles can collect.
- Ask your utility whether the pipe from the main to your house is lead. If it doesn't know, a licensed plumber can check.
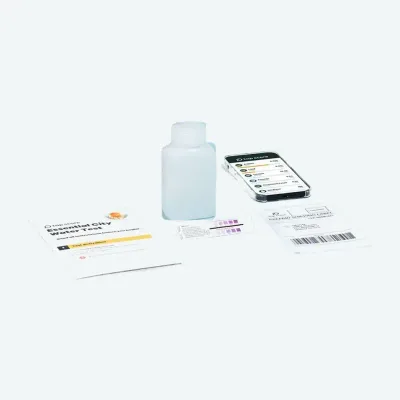
The utility's lead number describes its sampling sites, not your faucet. To know your own, test your tap for lead.
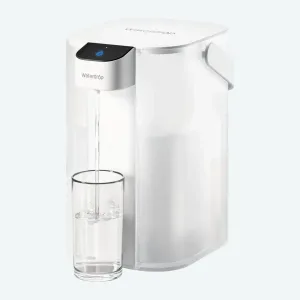
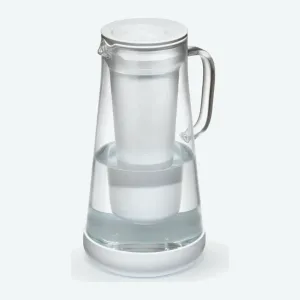
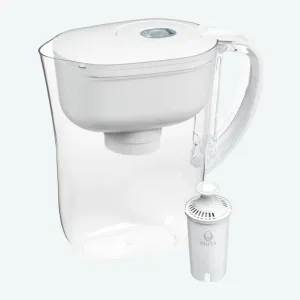
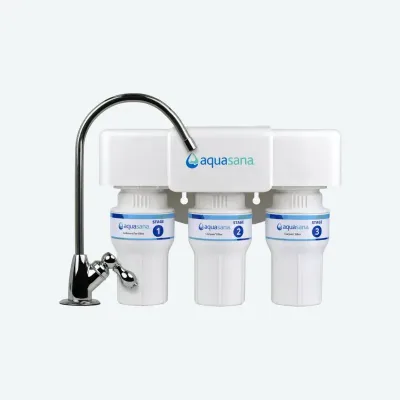
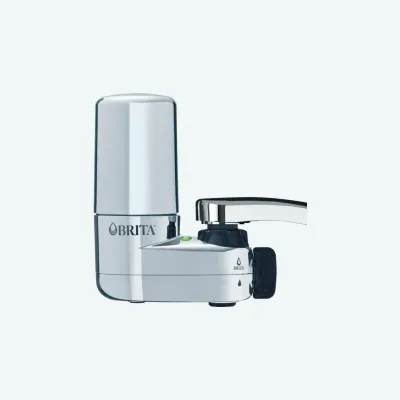
A filter is the other option EPA lists. Pick one whose NSF or WQA listing names lead, such as a certified pitcher or under-sink filter, and follow its cartridge schedule. A listing shows the filter reduced lead in a lab test, not that your water ends up with none.
Not necessarily in your water. Check your utility report or a tap test before you buy for lead.
Private wells: nobody tests the water for you
EPA puts it bluntly: private well owners are responsible for the safety of their own water. Wells are not regulated under the Safe Drinking Water Act, and most states don't regulate them either. That covers about 15% of the US population, over 43 million people.
The same EPA page cites a USGS study of about 2,100 private wells: roughly one in five had at least one contaminant above a level of concern for human health. CDC lists animal waste, septic systems, flooded sewers and fertilizer as common sources of nitrate in wells.
CDC asks every well owner to test at least once a year for:
- total coliform bacteria, a sign that germs can get in,
- nitrates, which are most dangerous for babies,
- total dissolved solids and pH, which affect taste and pipe corrosion.
CDC recommends a state-certified lab, and your health department can say whether to add lead, arsenic, radium or pesticides. Test again if there's flooding near the well, after any repair, or when the taste, color or smell changes. If a result shows germs or chemicals, CDC suggests bottled water or another source in the meantime.
Mail-in lab kits and strips are compared in home test kits. Which tests a well needs, when to repeat them and what to do with a result over the limit: how to test a private well.
PFAS: the newest limits start in 2029
PFAS are a large family of long-lasting man-made chemicals. On April 10, 2024 EPA set the first national limits: 4.0 ppt each for PFOA and PFOS, with a health goal of zero. Public systems have until 2029 to comply. On May 18, 2026 EPA proposed keeping both limits, letting systems ask for two more years, to 2031, and dropping the separate limits for PFHxS, PFNA, HFPO-DA and a mixture of PFAS.
That timeline matters when you read the numbers above. The UCMR 5 samples were taken before the limits apply, so a 2024 sample over 4 ppt is not a violation. Compliance will be judged on a running annual average, not one test. It does tell you which systems have work to do, and the city pages show each system's PFOA and PFOS result next to the 4.0 ppt line.
If your system reports PFOA or PFOS, the home option is a filter whose listing names those two chemicals. Some pitchers, under-sink filters and reverse osmosis systems carry it. Boiling won't help, since CDC says it doesn't take chemicals out of water.
Not necessarily in your water. About 65% of systems in UCMR 5 found none of the 29 PFAS it looked for.
Germs, boil-water notices and short-term problems
CDC estimates at least 1.1 million people in the US get sick each year from germs in drinking water, about 1 in 300. Legionella is the most common cause of outbreaks. It grows in building water systems such as faucets and water heaters, and most outbreaks are in hotels, hospitals and care homes with large plumbing.
Treatment plants disinfect water with chlorine, chloramine or chlorine dioxide and leave a small amount in the pipes on purpose, so it keeps working on the way to your house. After a hurricane, a flood or a broken main, EPA notes that local officials may tell you to use only bottled, boiled or disinfected water.
When one comes, CDC’s advice is simple: boiling is the best way to kill germs in water. Bring it to a rolling boil for 1 minute, or 3 minutes above 6,500 feet, and keep doing it until the notice is lifted.
Why tap water can taste bad and still meet the limits
Bad taste and smell are usually about looks and comfort, not health. Of the 125 cities we track, 19 use chloramine and the rest chlorine as the disinfectant that stays in the pipes.
Minerals do the rest. CDC explains that EPA's secondary standards cover 15 chemicals, such as iron, manganese, sulfate and chloride, that affect taste, color or smell rather than health. Utilities are not required to meet them. EPA warns that “odor-free water is not necessarily safe to drink,” and bad taste can push “a great number of people” away from their public supply. Total dissolved solids, the number on cheap TDS meters, is one of those 15. It measures how much is dissolved, not whether any of it is harmful.
If taste is the only issue, a carbon filter listed under NSF/ANSI 42 for chlorine reduces the taste and odor. For chloramine, look for chloramine named in the listing, since not every carbon filter covers it.
Not necessarily in your water. Your utility report says which disinfectant your system uses.
How to check your own tap water
Most of the answer costs nothing.
- Read your utility's annual report. EPA requires community water systems to send it by July 1 each year. It lists every regulated contaminant found, the level and the limit. EPA’s local water page shows how to find yours.
- Look up your system on our water quality pages, which show EPA's lead, PFAS and violation records with dates.
- Ask whether your service line is lead. If it is, or nobody knows, test the tap itself, especially with a baby in the house.
- On a well, send a sample to a state-certified lab every year.
- If a report or test shows something above a limit, choose a filter whose listing names that contaminant. CDC notes that if your water is already free of harmful germs and chemicals, you may not need one.
None of this replaces advice from your doctor or your local health department, especially during pregnancy or for a baby's formula. See our health disclaimer for how we use these sources.
Questions people ask
Can you drink all tap water in the USA?
Not all of it without checking. Water from public systems, which serve about 9 in 10 people, must meet EPA limits, and the utility must warn you when it doesn't. Private wells aren't regulated, homes with lead service lines can have more lead than the system average, and any town can be under a temporary boil-water notice. Look up your city or ZIP for your system's record.
Why do some people refuse to drink tap water?
Often it's taste and smell from chlorine, chloramine or minerals. EPA's standards for those cover taste, not health. Trust is the other part, and many still point to Flint, where the latest lead result is 3 ppb at the 90th percentile of home taps.
Is bottled water safer than tap water?
Not by default. Bottled water is regulated by the FDA, which adopts EPA’s tap water standards for it or decides they aren't needed. One difference FDA points out is lead: 5 ppb for bottled water against the 15 ppb action level for public systems, because bottled water doesn't travel through lead pipes.
Does boiling tap water make it safe to drink?
Ready to pick one?
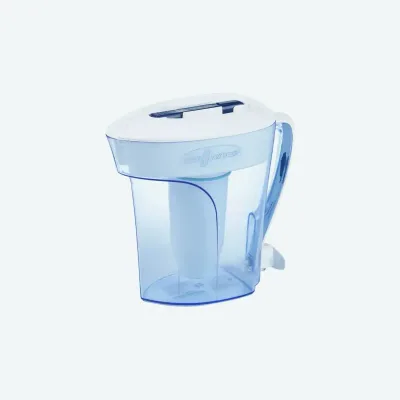
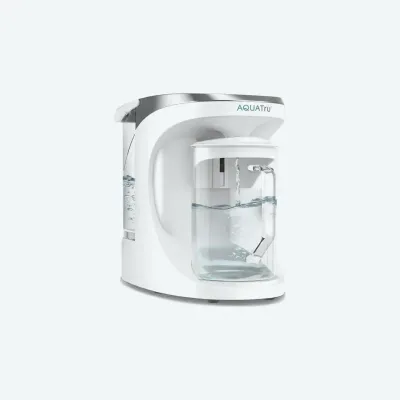
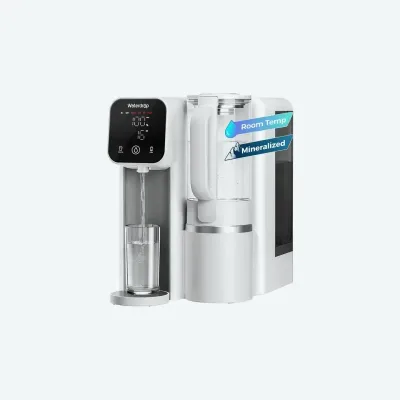
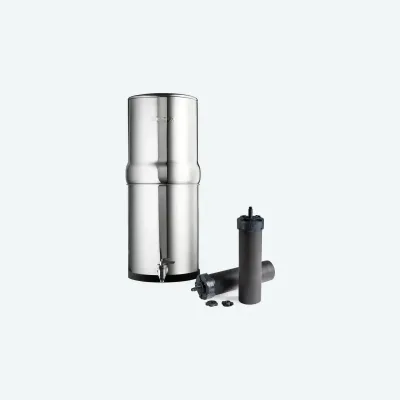
I compare 14 pitchers on certification, yearly cartridge cost, warranty and owner reviews. These score highest right now.